How to Use the Usage Page
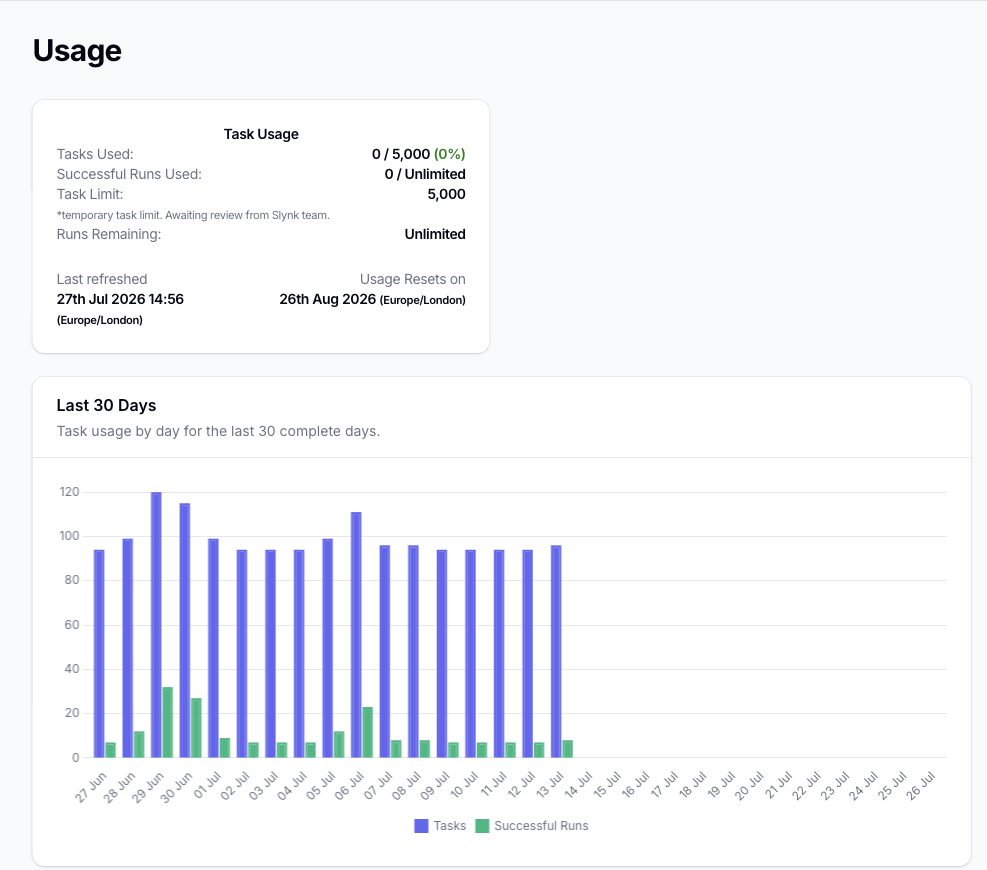
The Usage page gives you a high-level view of how many Morph tasks and successful app runs have been used and how that usage is changing over time.
It is useful when you want to check current progress against your plan limits, compare recent activity, or spot unusual usage spikes.
Where to Find It
Log in to the Slynk dashboard, open your Morph app, and click Usage in the left-hand navigation.
What the Page Shows
The top summary card shows:
Tasks UsedSuccessful Runs UsedTask LimitRuns RemainingLast refreshedUsage Resets on
This lets you quickly confirm how much of your current allowance has already been used and when the allowance resets.
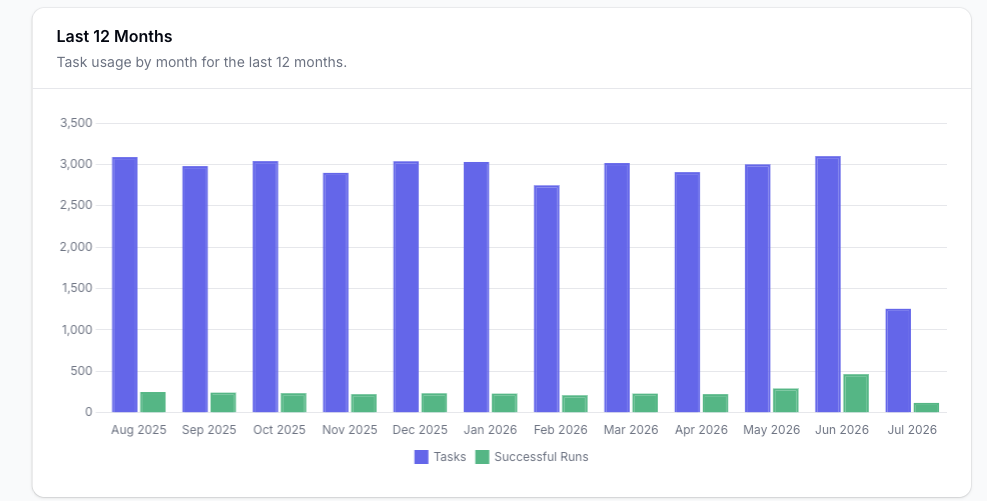
Below that, the page includes charts showing task and successful-run usage for the last 30 complete days and the last 12 months.
What the Colours Mean
Task usage percentages change colour as your consumption increases:
- green when usage is below
75% - orange when usage reaches
75% - red when usage reaches
90%
When task usage reaches 90% or more, the page also shows a warning that further tasks will stop processing when the limit is reached.
When to Use This Page
Use the Usage page when you want to:
- check how close you are to your task or run limit
- compare current usage with previous days or months
- spot unusual spikes in task or successful-run consumption
- confirm when the usage total was last refreshed
What This Page Does Not Show
The Usage page is for totals and trends.
It does not show which specific morph or run used the tasks.
If you need to investigate where usage was consumed, check the Runs page and then open the matching logs for the run you want to inspect.
If you want to understand what counts as an action or run in the first place, see Actions and Usage.