How to use the queue usage page
The Usage page gives you a high-level view of queue activity over time.
It is useful when you want to see whether sync activity has increased, dropped, or shifted between different queue types.
Where to find it
Log in to the Slynk Dashboard, open your Epos Now WooCommerce app, and click Usage in the left hand menu.
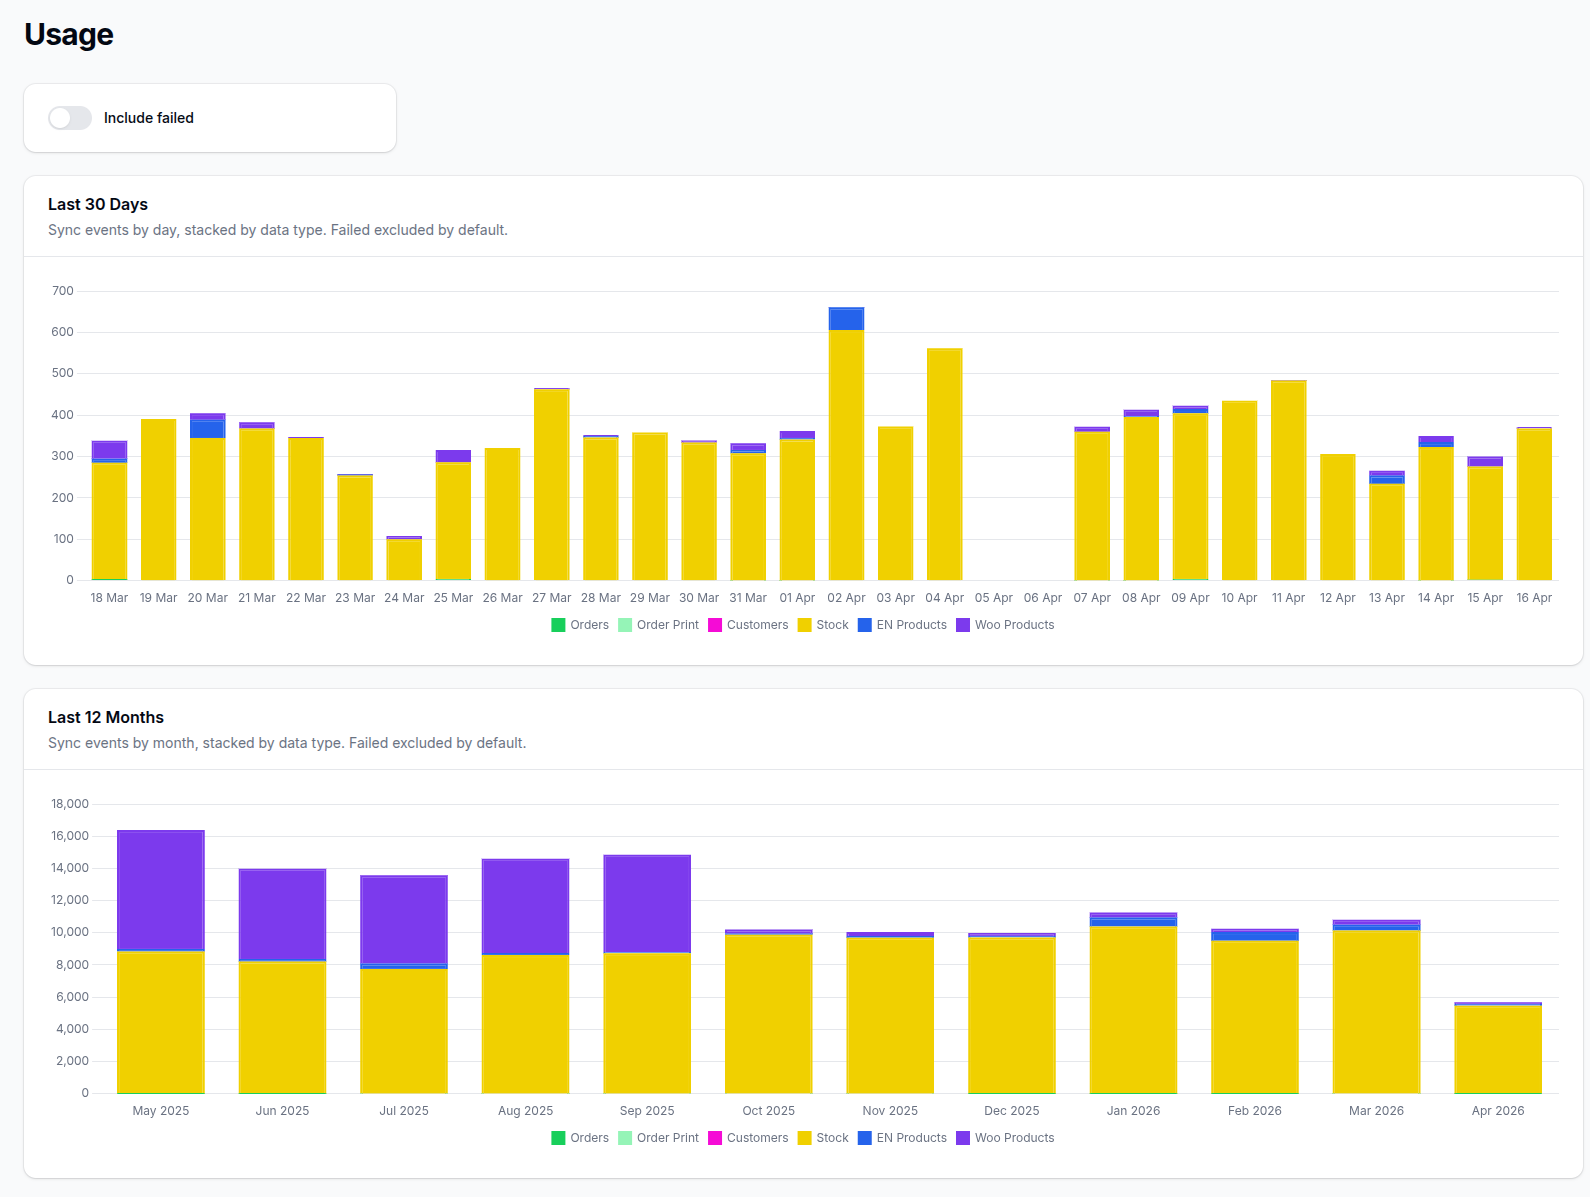
What the page shows
The page includes:
- a
Last 30 Dayschart - a
Last 12 Monthschart - stacked totals by data type for
Orders,Order Print,Customers,Stock,EN Products, andWoo Products
This makes it easier to spot which part of the integration is creating most of the queue activity.
Include failed
By default, failed items are excluded from the charts.
Turn on Include failed if you want failed queue events included in both charts as well.
When to use this page
Use the Usage page when you want to:
- compare recent sync activity with earlier days or months
- spot unusual spikes or drops in queue activity
- see which sync type is creating most of the workload
This page is for trends and volume, not for checking individual queue entries.
If you need to inspect a specific item or error, use How to check the queue status.